WHOOP as Your Health Compass: Decode Your Scores, Elevate Your Life [Part 1]
TL;DR
Core Concept: This article kicks off a 3-part series designed to decode the WHOOP Core Score Matrix—but more importantly, it lays the foundation for a shared Health Compass at ALEA. While becoming aware of your health scores is already a step forward, understanding how to translate them into individualized goals is what empowers each team member to take autonomous and proactive action. This Compass is not just about metrics—it’s about collective alignment, ownership, and daily movement toward better health and performance.
Significance: By focusing on two foundational metrics—Sleep Score and Heart Rate Variability (HRV)—this first article helps employees learn how to interpret and use their data with context. With WHOOP devices already in place, this knowledge becomes a driver for smart recovery, better energy, and more sustainable productivity.
Challenges: Interpreting raw scores in isolation can be misleading. Both sleep and HRV are highly personal, influenced by age, lifestyle, genetics, and stress. That’s why we propose an individualized approach: using your personal baseline, group benchmarks, and a staged progression strategy (e.g., +10% improvement) to define meaningful targets.
Strong Fact: In a WHOOP community of over 430,000 users aged 20–40, the average Sleep Score is 76.4%. ALEA’s target is set at 85%, reflecting the positive impact of structured interventions—proving that guided support and self-awareness can shift the baseline upward.
OVERVIEW
You’ve all had the opportunity—and the privilege—of receiving a WHOOP device: one of the most advanced personal health trackers available today.
With this tool, you can measure critical indicators of your recovery, stress, sleep quality, cardiovascular performance, and even your rate of aging. That’s the promise of WHOOP: turning invisible health dynamics into clear, actionable feedback.
But this article isn’t about promoting the device—it’s about showing you how to make sense of the scores it gives you. We’ll explore how, with just a few key metrics, you can steer your health, performance, and wellbeing in the right direction—day after day, and month after month.
In short: you already have the tool. Now let’s unlock its full potential.

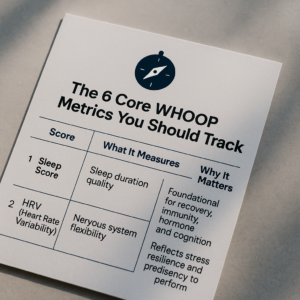
🧭 The 6 Core WHOOP Metrics You Should Track
These six scores are the foundation of the WHOOP system and offer powerful insights into your physical and mental health (in the order of importance):
| Score | What It Measures | Why It Matters |
|---|---|---|
| 1. Sleep Score | Sleep duration & quality | Foundational for recovery, immunity, hormone balance, and cognition |
| 2. HRV (Heart Rate Variability) | Nervous system flexibility | Reflects stress resilience and readiness to perform |
| 3. VO₂max | Max aerobic capacity | Key predictor of longevity, cardiovascular health, cognitive function |
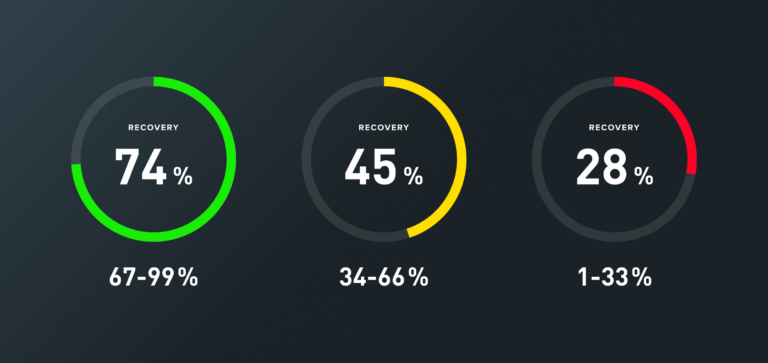
| 4. Recovery Score | Daily readiness index [Aggregated Score] | Integrates HRV, sleep, strain into one actionable score |
| 5. Strain Score | Daily cardiovascular & muscular load | Helps optimize training and avoid burnout or underuse |
| 6. Biological Age (Healthspan) (New Peak Feature) | Rate of aging based on key biomarkers. [Aggregated Score] | Compares your physiological age to your real age, tracks how daily habits accelerate or slow down aging. |
1. Sleep Score & Sleep Score Target for Alea
Sleep Score Target for ALEA : ≥ 85% (monthly AVG) [HIGHLY RECOMMENDED]
Why it matters: Sleep is the NUMBER ONE tool for your body and brain to recover, detoxify, and repair.
Thus, your sleep score is non negotiable.
Relevance of WHOOP’s Sleep Score: WHOOP has been validated against gold-standard sleep lab tools (polysomnography), demonstrating 89% accuracy in detecting sleep vs. wake states. (Source: [1])
Sleep Score Breakdown (How it is calculated) : you can find the detail here.
Why this specific score ?
First, let’s consider the general recommendation from Whoop (Ref [2])
WHOOP Sleep Metrics — Performance Zones :
| Metric | 🟢 Optimal | 🟡 Sufficient | 🔴 Poor |
|---|---|---|---|
| Sleep Performance Score | 🟢 85%+ | 🟡 70–85% | 🔴 <70% |
| Hours vs. Needed | 🟢 85%+ | 🟡 70–85% | 🔴 <70% |
| Sleep Consistency | 🟢 80%+ | 🟡 70–80% | 🔴 <70% |
| Sleep Efficiency | 🟢 90%+ | 🟡 80–90% | 🔴 <80% |
| Sleep Stress | 🟢 <1% | 🟡 1–5% | 🔴 >5% |
Then if we consider the data from different large whoop community groups :
| Group | Population Size (k) | Average Sleep Score (%) |
|---|---|---|
| Men (20–30 years) | 157 | 77% |
| Men (30–40 years) | 144 | 77% |
| Women (20–30 years) | 69.6 | 70% |
| Women (30–40 years) | 61.1 | 81% |
=> Global Weighted Sleep Score Average: 76.4%
Why ALEA’s Target Sleep Score Is Set at 85% ?
The WHOOP community dataset includes over 430,000 individuals aged 20–40. Their weighted average Sleep Score is 76.4%—and yet, they are not part of any structured health optimization program.
At ALEA, employees benefit from proactive interventions: sleep hygiene coaching, cold exposure, breathwork, circadian light practices, and recovery tracking.
👉 That’s why it’s reasonable to set the ALEA target at 85% (optimal level).
While not a clinical benchmark, it reflects the expected uplift from personalized health support—compared to a large, unguided population baseline.
2. HRV (Heart Rate Variability)
HRV Target for ALEA : Individualized Target to be chosen (best baseline +10 %)
Why it matters:
HRV is one of the most powerful, real-time indicators of your nervous system balance.
It reflects how well your body recovers, adapts to stress, and maintains resilience.
Higher HRV generally means better recovery, lower inflammation, and greater readiness.
That’s why HRV is considered a core longevity and performance marker.
In simple terms: the higher your HRV, the more adaptable and stress-resilient your system is.
Note for those that are paying more attention to “recovery score” : the HRV is a STRONG UNDERLYING component of the “RECOVERY”. Of course, we’ll also be discussing the recovery score further, but for now, keep it mind that the higher your sleep score and the higher your HRV, the better your recovery score will be. And you can ACT on HRV & Sleep.
Relevance of WHOOP’s HRV Score: WHOOP measures nighttime RMSSD HRV, one of the most stable and relevant form for tracking recovery. It aligns with peer-reviewed references such as Nunan et al. (2010) and has been validated as sensitive to physiological stress, fitness level, and age-related decline.
Studies confirm that WHOOP HRV patterns correlate well with training stress, illness onset, and recovery states. (Source: 6, 10)
WHOOP’s HRV score, based on nighttime RMSSD, is a scientifically validated and reliable measure for tracking physiological recovery, stress, and readiness. Its methodology and accuracy are supported by independent peer-reviewed studies, and its patterns have been shown to correlate with training load, illness, and recovery states.(source [6][7][8])
Why this specific individual target?
Heart Rate Variability (HRV) isn’t like other metrics—it’s deeply individual. Unlike a sleep score or a resting heart rate, your HRV is shaped by multiple intertwined factors : age, sex, biological gender, overall fitness, lifestyle habits, genetics and even your psychological state.
This is why it’s not meaningful to simply chase a universal “high HRV” number.
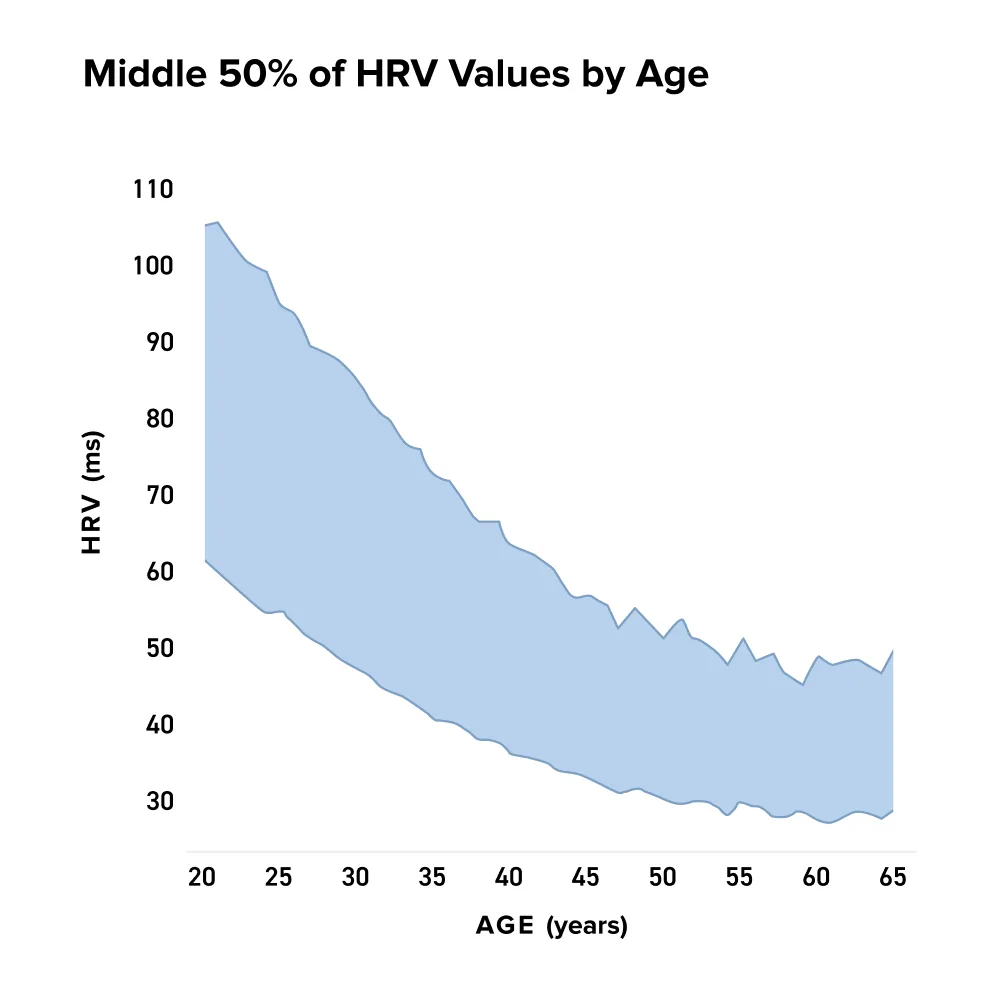
Here is the HRV Positioning Channel Chart for both men and women, by age group:
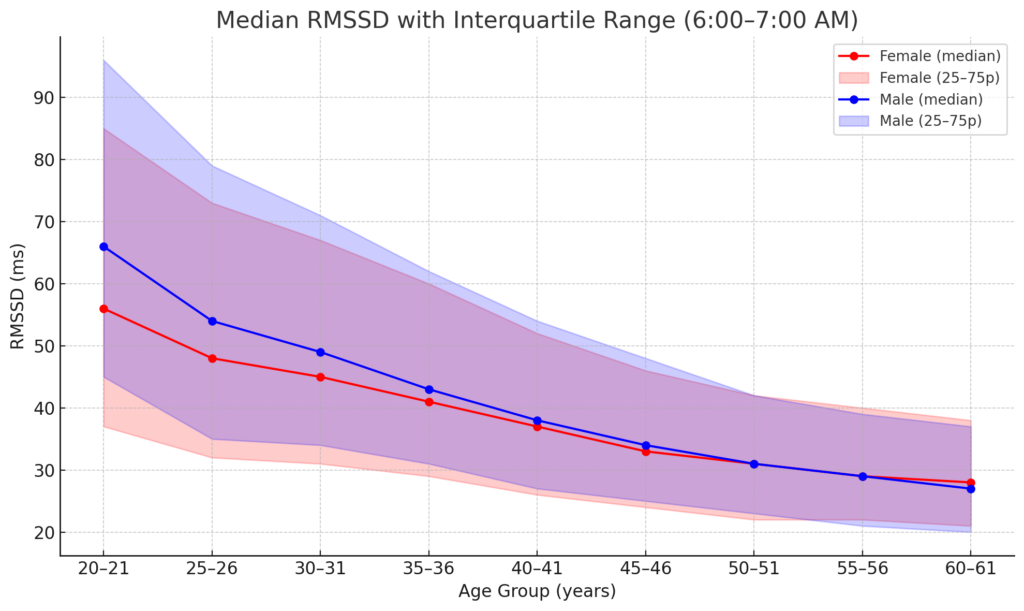
Graphic notes :
- Dashed lines: Median RMSSD between 6:00 and 7:00 AM for males (🔵) and females (🔴).
- Shaded areas: Interquartile range (25th–75th percentile) for each sex.
- The graph uses data based from the Lancet “Heart rate variability with photoplethysmography in 8 million individuals: a cross-sectional study” [source 9]. The graph can’t be used as an absolute rule but it helps you to have a better idea of where you sit.
(NOTE : I previously used a Baependi Heart Study (source [4]) and community distributions from WHOOP data (source [5]). And the data was less complete that the lancet one.)
The best approach to your HRV target should be :
Phase 1: Understand your historical baseline & Compare to known data
- Compare your current HRV to your own baseline,
- Track your trends over time: Are you improving? Is your nervous system more resilient? Are you recovering faster?
- Use known reference charts—like the one shared above—to locate yourself within the expected range for your demographic. While the scientific data isn’t perfect, it helps you visualize a “healthy band” for your age and sex.
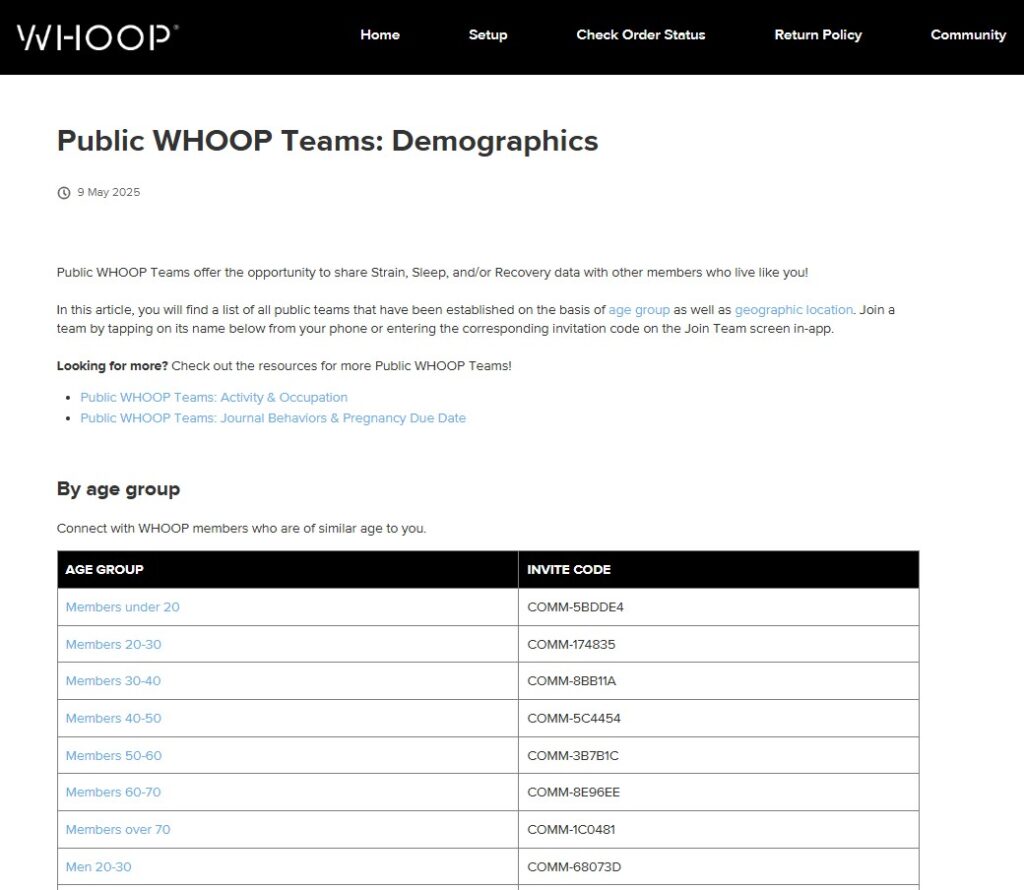
- Contextualize using WHOOP community data, comparing yourself also to people with similar profiles in age, sex, and activity level. (explore communities for that : LINK HERE)
Phase 2: Set your individual target
Once you’ve identified your personal HRV baseline and contextualized it using group and reference data, the next step is to set a realistic yet motivating progression plan.
- Step 1: Return to Your Personal High
Your first objective should be to recover your highest historical average—that is, the best HRV range you’ve already achieved in the past. If you’re currently in a downward trend, this becomes especially important: your best previous average is proof that your system is capable of reaching it under the right conditions.
This isn’t about aiming high for the sake of ambition—it’s about reconnecting with your known potential. Returning to your personal high is the most grounded and data-respectful target you can set. It builds confidence and sets the foundation for sustainable growth.
2. Step 2: Add a +10% Improvement Challenge
Once you’ve stabilized back at your best, you can set a new goal:
→ Increase your HRV by an additional 10% over the next few weeks or months.
This improvement target isn’t completely arbitrary—it’s rooted in what we know about: the adaptive potential of the parasympathetic nervous system.
The 10% represents a PROGRESSIVE improvement not the absolute end goal. It reflects steady progress, helping you shift from your current baseline to new heights over time.
Also the compound effects of ALEA’s optimized recovery environment (cold exposure, sleep hygiene, breathwork, HBOT, light therapy), and the reality that you’re not just part of a general population—you’re part of a community actively engaged in biohacking, health tracking, and behavior optimization should enables you to reach that goal.
Final word, even though the +10% target might feel “pulled from the air,” it serves as a structured and scalable challenge—ambitious but grounded in your individual physiology and collective context.
Therefore, approaching this like this, it gives you a reasonable low-to-high range—a personal HRV bandwidth. That way, you’re not setting an impossible goal based on elite athletes or idealized charts. You’re building a realistic target zone that evolves with you.
This makes it easier to set realistic, sex- and age-adjusted targets for biohacking progress.
📈 The goal isn’t to hit a number. The goal is to move your own curve upward toward a “reasonable” goal.
Case Study – Erwin’s HRV Strategy: Setting a Personalized Target
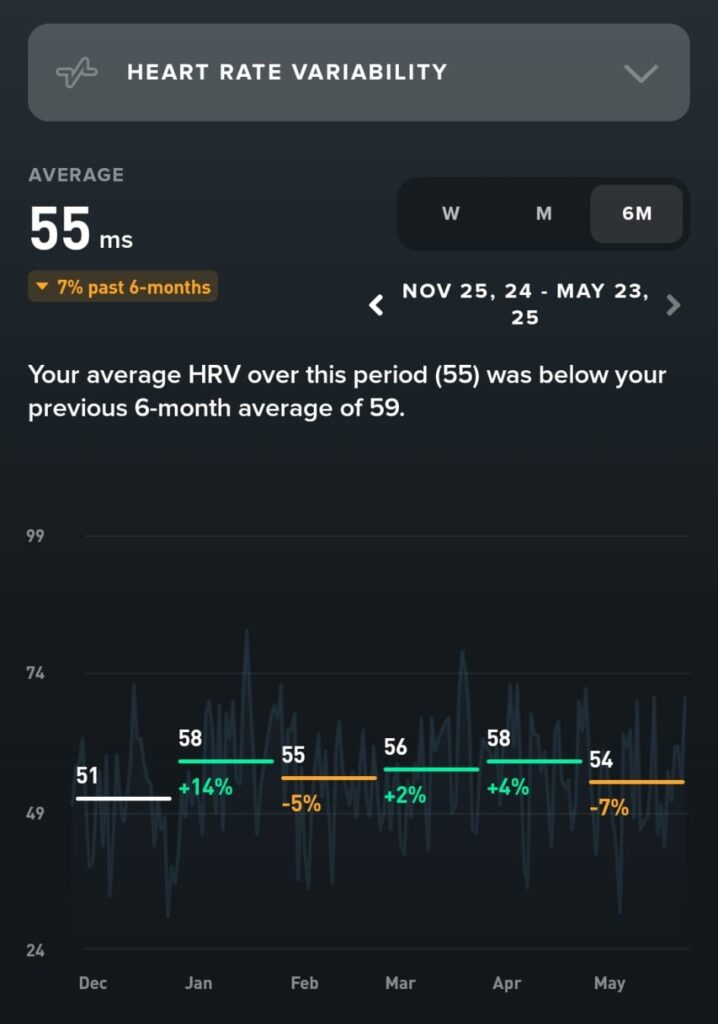
Over the past 6 months, my average HRV has settled at 55 milliseconds. According to the percentile charts and cohort benchmarks, this places me above the median for men in my age group—a sign that my baseline vagal tone is relatively solid.
However, comparing to the previous 6-month period, I’ve noticed a 7% decline in my average HRV. Even though I’ve been putting effort into recovery practices, the trend suggests a decrease in autonomic resilience. And I know that I’ve previously maintained a higher average—above 60 ms—which means I’m capable of more.
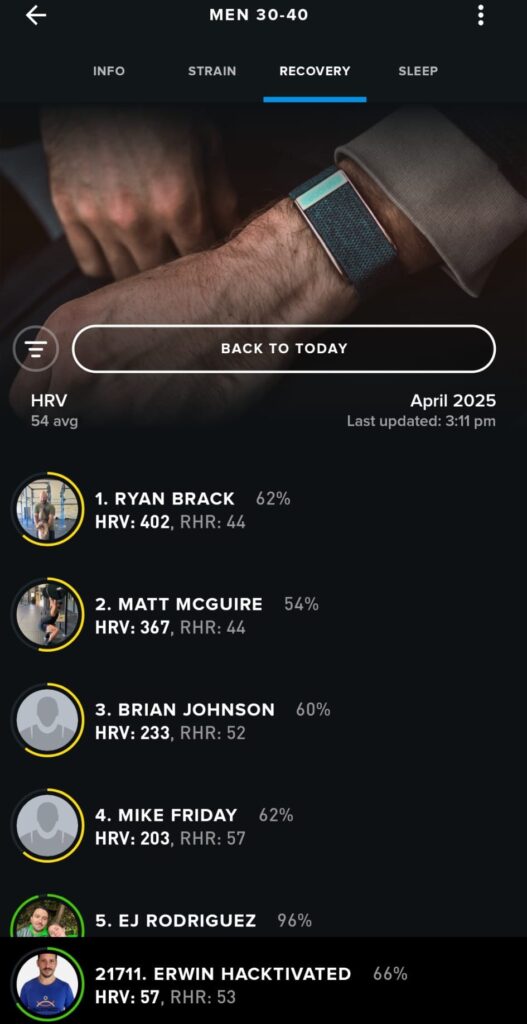
To further contextualize my HRV score, I looked at the WHOOP Community data: for men aged 30–40, the average HRV this month sits around 54 ms, across a massive sample of 144,000 users. So yes, I’m currently doing better than average—but that alone isn’t enough. HRV is extremely variable between individuals. Some elite users push beyond 100, 150, even 200 ms, but these values likely reflect exceptional genetics, metabolism, and training background.
So how do I define a realistic and motivating target?
Rather than chasing generic “high” values, I’m applying a two-phase personal strategy:
- Phase 1: Return to my own historical high baseline
My short-term goal is to rebuild back to 59 ms, which was my previous “personal best” average. This value isn’t arbitrary—it’s proven and lived, meaning I know my body can reach it when properly supported. - Phase 2: Go 10% further
Once I reestablish my baseline, I’ll aim for a 10% improvement, which takes me into the 65 ms+ zone. This is ambitious, but not extreme. It respects the biological individuality of HRV while providing a motivating and measurable stretch goal.
That’s why relative progress—not comparison—is the real KPI.
📌 My strategy isn’t to hit someone else’s number. It’s to climb my own curve again—first to 59, then to 65.
This method balances science, self-awareness, and motivation—rooted not in pressure, but in potential.
HOW TO GET INTO HACKTION?

Practical Instructions
Let’s keep it simple. You’ve now got a clearer understanding of why Sleep Score and HRV matter. Here’s how to start applying that awareness—today.
1. Sleep Score → Aim for 85%
- 📍 Check your current monthly average Sleep Score. Are you above or below 85%?
- 🎯 Set that 85% as your personal target. Not as a pressure, but as a compass.
- ✏️ Note down one small action you could take this week to improve it. For instance:
👉 Eating your last meal at least 4 hours before bedtime has been shown to improve both Sleep Score and HRV—a double win.
Your only job for now? Become aware of where you are, and move one small step toward where you want to be.
2. HRV → Reconnect with Your Baseline
- 📍 Look at your HRV trend in the WHOOP app. Where do you stand compared to your best average?
- 🎯 Set a first target: return to your personal best HRV.
- ✏️ Pick one micro-action to support vagal tone and recovery. For example:
👉 Do a 5-minute coherence breathing session before bed to activate the parasympathetic system.
AUTHOR’S NOTE
As we wrap up this first part, I’d like to leave you with two important reflections.
1. Let’s keep this fun and human.
The WHOOP Score Matrix is a powerful tool—but at its core, it’s designed to gamify your health journey, not to add pressure or guilt. The idea is to give you a clear, personal direction—a North Star—that feels realistic, aligned with human biology, and grounded in credible data.
Your goal should not be perfection. Your goal is awareness. And from that awareness, set a personal benchmark that feels motivating. The timeframe and path to get there? Entirely yours.
This is about feeling better, having more energy, and enjoying your body and mind in better alignment. That’s it.
2. Trackers aren’t perfect—don’t obsess over the numbers.
Even the best wearables have limits. WHOOP is incredibly sophisticated, but it’s not infallible. The scores you see aren’t absolute truths—they’re indicators. Use them to build awareness, not anxiety.
Don’t get stuck on a single night’s score or a bad HRV day. Zoom out. Reflect. Adjust. Move forward.
This is a journey of conscious self-regulation, not digital obedience. Use the data as a mirror—not a judge.
In the end, the only score that truly matters is the one you feel—when you wake up rested, move with ease, and live with clarity.
Stay curious. Stay kind to your process.
CONCLUSION (PART 1)
In this first part, we’ve unpacked the foundational metrics of Sleep Score and HRV, two core pillars of the WHOOP Score Matrix. Beyond just tracking numbers, we’ve shown how these metrics can become true navigational tools—helping each ALEA team member orient themselves, set personal targets, and engage in a more intentional journey toward better health and performance.
The takeaway?
You already have the data. Now it’s time to use it—to reflect, to recalibrate, and to move forward with clarity.
Stay tuned for Part 2, where we’ll explore the interplay between Recovery, Strain, and how to balance effort with readiness to thrive over time.
Erwin
F.A.Q
What’s more important—Sleep Score or HRV?
Both matter, but they serve different purposes.
HRV reflects how well your body responds to that recovery—your resilience.
Ideally, aim for high performance on both, but if one is off, start by fixing your sleep.
Sleep Score reflects how much and how well you sleep—your base of recovery.
My HRV is low—should I be worried?
Not necessarily. HRV is highly personal and depends on age, sex, fitness, and stress.
Rather than compare to others, compare to your own baseline.
Your goal: progress over time, not perfection. Start by stabilizing, then aim for a +10% improvement.
How often should I look at my scores?
Check them daily for feedback, but assess trends weekly or monthly.
Focus less on day-to-day fluctuations and more on long-term improvement.
If your scores are off for a few days, no stress—that’s part of the journey. Use it to recalibrate.
REFERENCES
[1] WHOOP Article : https://www.whoop.com/thelocker/how-well-whoop-measures-sleep/[2] WHOOP Article : https://support.whoop.com/s/article/WHOOP-Sleep?language=en_US [3] WHOOP Article: https://www.whoop.com/us/en/thelocker/what-is-a-good-hrv/[4] Geovanini, G. R., Vasques, E. R., Alvim, R. O., Mill, J. G., Andreão, R. V., & Bruna, B. (2020). Age and sex differences in heart rate variability and vagal specific patterns – Baependi Heart Study. Global Heart, 15(1), 1–10. https://doi.org/10.5334/gh.873https://globalheartjournal.com/articles/10.5334/gh.873[5] WHOOP ARTICLE : https://www.whoop.com/de/en/thelocker/normal-hrv-range-age-gender/[6] WHOOP ARTICLE : https://www.whoop.com/us/en/thelocker/heart-rate-variability-hrv/[7] Bellenger, C. R., Miller, D., Halson, S. L., Roach, G. D., Maclennan, M., & Sargent, C. (2022). Evaluating the typical day-to-day variability of WHOOP-derived heart rate variability in Olympic water polo athletes. Sensors (Basel), 22(18), 6723. https://doi.org/10.3390/s22186723 https://acuresearchbank.acu.edu.au/item/8×247/wrist-based-photoplethysmography-assessment-of-heart-rate-and-heart-rate-variability-validation-of-whoop[8] Bellenger, C. R., Miller, D., Halson, S. L., Roach, G., & Sargent, C. (2021). Wrist-based photoplethysmography assessment of heart rate and heart rate variability: Validation of WHOOP. Sensors, 21(10), 3571. https://doi.org/10.3390/s21103571
https://pmc.ncbi.nlm.nih.gov/articles/PMC9505647/[9] Natarajan, A., Pantelopoulos, A., Emir-Farinas, H., & Natarajan, P. (2020). Heart rate variability with photoplethysmography in 8 million individuals: A cross-sectional study. The Lancet Digital Health, 2(12), e650–e657. https://doi.org/10.1016/S2589-7500(20)30246-6